**Data Science: Python Final Project**


**Created on November 7, 2020**

**Team 19 :**

**- Chin Hsin Hsieh**
**- Dhananjay Sonawane**
**- Ines Cerdan**
**- Jose Eduardo Dominguez Navarrete**

About this Project


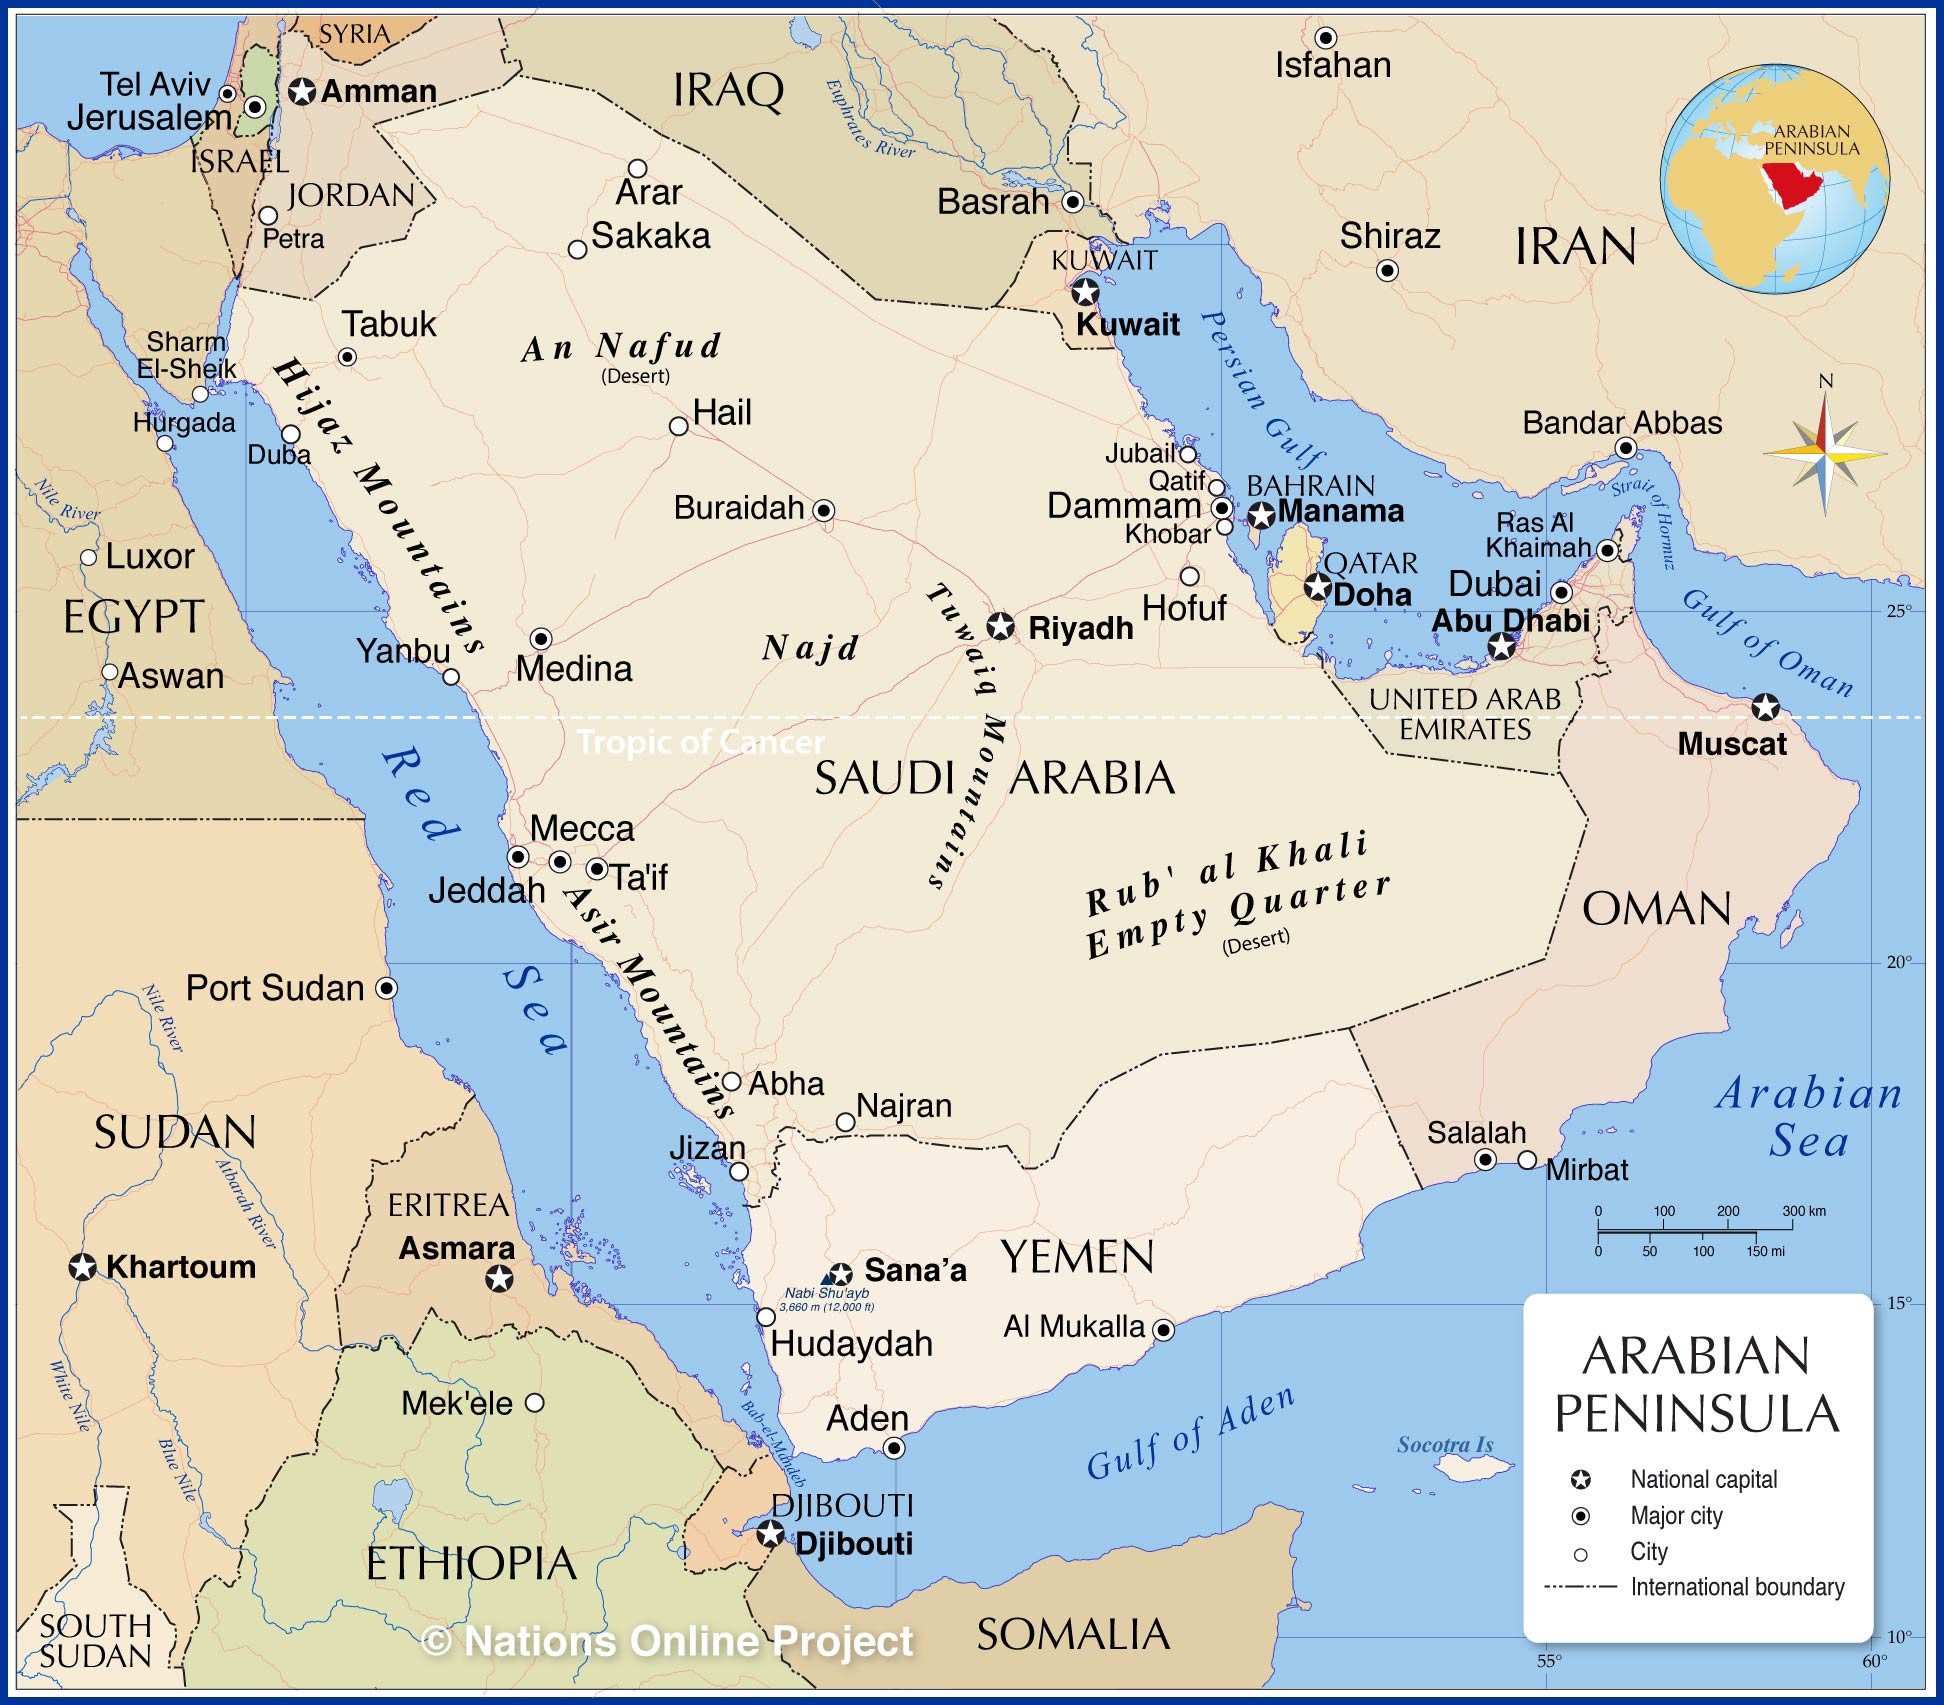
Figure 1: Arabian Peninsula Region

The dataset assigned for our group is the Arabian Peninsula region. (Figure 1) In this report, we will use the data of the World Bank for conducting various exploratory data analysis. Based on these analysis results, we will get the country who can most represent the Arabian Peninsula in the end of this report.

About Arabian Peninsula


The Arabian Peninsula is the largest peninsula in the world, located in the northern and eastern hemispheres in the western part of the Asian continent. It is a desert environment surrounded by saltwater bodies and bounded by the Persian Gulf, the Gulf of Aden, and the Red Sea. (Figure 2)

There are the following major countries on the Arabian Peninsula. According to the size of the country, they are Saudi Arabia, Yemen, Oman, United Arab Emirates, Kuwait, Qatar, and Bahrain. Among them, Saudi Arabia is the largest, its territory occupies 75% of the peninsula.

The Arabian Peninsula is controlled by the sub-high pressure zone and the trade wind belt all year round, and it is very dry. Almost the entire peninsula is a tropical desert climate zone with a large area of no flow and lacks natural freshwater resources. Therefore, economic activity is restricted and agricultural development is not conducive.

Despite that, the Arabian Peninsula has a large number of oil reserves along the Persian Gulf. Since the successful mining in the 20th century, it has brought huge wealth to the countries on the Arabian Peninsula adjacent to the Persian Gulf.


Figure 2: The Map of the Arabian Peninsula

Importing Dataset and Installing Essential Packages


In this section, we are going to import Data Packages to work with the data, and import Final Project Dataset and read it with pandas packages.

Cleaning and Subsetting Data


After we finished the importing and installing process, we'll start cleaning and subsetting to narrowing down our data.

Missing Value


In order to select the top 5 features in the data set and enhance the uniqueness when compared to the rest of the world, the strategy that we decided to use for the missing values is filled with the mean/median from our data.

For the missing values we decided to analyze the histograms of the data to see if there was any skewness to decide if the use of the mean or the median were appropriate, since we did not see any skewness, we imputed the mean to replace the missing values.

HEATMAP


From the above analysis, we got these 5 features are what made our region unique, which is:

To understand the top features of the Arabian peninsula region, we selected the attributes like the quality of life and analyzed the associated columns like; Education enrolment, immunization, sanitation facilities, and in order to understand public life as an attribute we used associated variables like access to technology like usage of mobile devices and internet users.

We found the strongest correlation in variable sanitation facilities with respect to students’ enrollment in primary education, life expectancy, immunizations, and internet access.

The relation between sanitation other variables can be elaborated as follows:

This correlation helped us in understanding how sanitation is one of the important factors to help enhance sectors like health, education, economics, and employment.

Another interesting correlation we analyzed was more the number of women participating in parliament results in higher enrolment rates of students for primary education and the other correlation was if employment rate is higher then the CO2 emissions are increased too, this can be associated with higher employment at oil refineries, factories and companies and higher use of transportations.

Represent Country - Israel


We decided to rank countries according to the above selected variables. We attributed points (1 worst- 4 best) to the 4 first countries for each variable. We then attributed weight to each defined variable using the related SDGs (Sustainable development Goals) coverage index for the Arabian Peninsula. Finally, we summed the points for each country to obtain our best performing country, which is Israel.


Figure 3 : Israel's Flag


Figure 4 : Location of Israel

**◆ Health-Immunization**
The measles immunization rate of children who ages 12-23 months is 98%, ranking second in the Arabian Peninsula, second only to Kuwait.

**◆ Life Expectancy**
The life expectancy in Israel is 80.95, which is one of the highest in the world. The longevity factor is its streamlined and efficient medical system.

**◆ Internet Users**
Looking at the data below, the Internet users (per 100 people) in Israel is 59.39, is No.2 of the top internet users in the region.

**◆ Mobile Subscription**
In the richer countries in the world, adults use smartphones in the majority, among which Israel Mobile cellular subscriptions (per 100 people) reach 126.5.

**◆ Sanitation**
The Improved sanitation facilities (% of the population with access) in Israel is 100%, the highest in the world.

The Arabian Peninsula Compare to the World


**Analysis**


Our Analysis is based on the Sustainable Development Goals (SDG) framework of 17 goals which is set with a vision to have our world free from poverty, hunger, and health disorder. Out of the 17 goals from the SDG, we have compared and analyzed the Arabian Peninsula with the other regions and the world data. The following are the variables considered for analysis:

Health –

Education –

Digitization –

Sanitation –

Trade –

Conclusion


The Arabian Peninsula in recent years is on track to attain the development goals when compared to world standards. The key finding from the data analysis are as follows -


Figure 5 : Relief Map of the Arabian Peninsula


References


Figure 6: the Arabian Peninsula